Ben’s Pizzeria

Table of Contents
- Objective
- Data Source
- Project Stages
- Design
- Development
- Testing
- Visualization
- Analysis
- Recommendations
- Implementation Plan
Objective
Create a comprehensive data management and analytics system for Ben’s Pizzeria to optimize operations and drive business decisions through:
- Building a normalized SQL database to manage orders, inventory, and staff data
- Creating interactive dashboards to visualize key business metrics
- Implementing data-driven insights for inventory management and staff scheduling
- Analyzing sales patterns and customer behavior to improve business operations
Key Areas of Focus
- Order Management & Sales Analysis
- Inventory & Stock Control
- Staff Scheduling & Cost Management
Data Source
Data is sourced from learnbi.online/pizzaproject providing information on:
- Menu items and pricing
- Ingredient costs and inventory
- Order details and history
- Staff information and schedules
- Customer data
Project Stages
- Design
- Development
- Analysis
- Recommendations
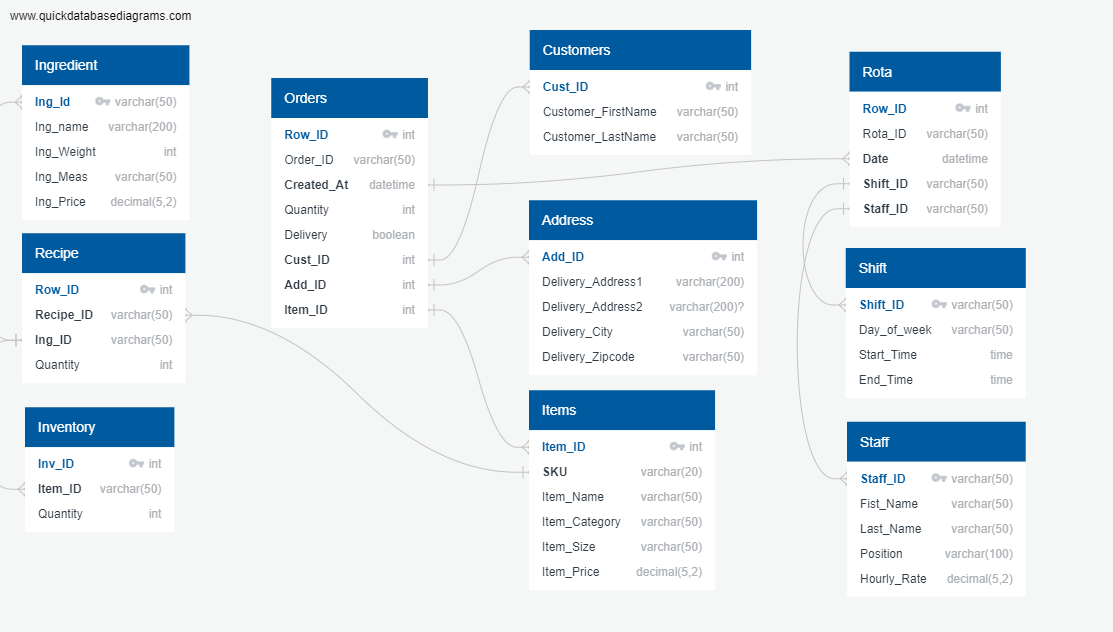
Design
Database Design
Dashboard Components Required
Orders Management
- Order ID, Item Name, Price, Quantity
- Customer Information
- Delivery Details
- Product Categories
Stock Control
- Ingredients Inventory
- Recipe Requirements
- Stock Levels
Staff Management
- Employee Information
- Shift Schedules
- Labor Costs
Tools Used
| Tool | Purpose |
|---|---|
| Excel | Initial data exploration |
| SQL Server | Database creation and analysis |
| Power BI | Interactive dashboard creation |
| GitHub | Project documentation |
| QuickDBD | Database schema design |
Development
Database Structure
Orders Table
Row_ID      int         PK
Order_ID    varchar(50)
Created_At  datetime    FK
Quantity    int
Delivery    boolean
Cust_ID     int         FK
Add_ID      int         FK
Item_ID     int         FK
[Additional table structures omitted for brevity]
SQL Views Created
Order Activity View
CREATE VIEW Order_activity AS
SELECT
    orders.order_id,
    items.Item_Price,
    orders.Quantity,
    items.Item_Category,
    items.Item_Name,
    orders.Created_At,
    address.Delivery_Address1,
    address.Delivery_Address2,
    address.Delivery_City,
    address.Delivery_Zipcode,
    orders.Delivery
FROM Orders
LEFT JOIN items ON Orders.Item_ID = items.Item_ID
LEFT JOIN address ON Orders.Add_ID = address.Add_ID
Inventory Management View
CREATE VIEW Stock1 AS
SELECT
    S1.Ing_name,
    S1.Ing_Id,
    S1.Ing_Weight,
    S1.Ing_Price,
    S1.item_name,
    S1.order_quantity,
    S1.recipe_quantity,
    S1.order_quantity * S1.recipe_quantity as Ordered_weight,
    S1.Ing_Price/s1.Ing_Weight as unit_cost,
    (S1.order_quantity * S1.recipe_quantity) * (S1.Ing_Price/s1.Ing_Weight) as ingredient_cost
FROM [subquery omitted for brevity]
Staff Cost View
CREATE VIEW Staff_cost AS
SELECT
    rota.Date,
    staff.First_Name,
    staff.Last_Name,
    staff.Hourly_Rate,
    shift.Start_Time,
    shift.End_Time,
    ((HOUR(TIMEDIFF(shift.end_time,shift.start_time))*60) +
    (MINUTE(TIMEDIFF(shift.end_time,shift.start_time))))/60 as hours_in_shift,
    [calculated staff cost column] as staff_cost
FROM rota
LEFT JOIN staff ON rota.Staff_ID = staff.Staff_ID
LEFT JOIN shift ON rota.Shift_ID = shift.Shift_ID
Visualization
Interactive Dashboards Created
Order Activity Dashboard
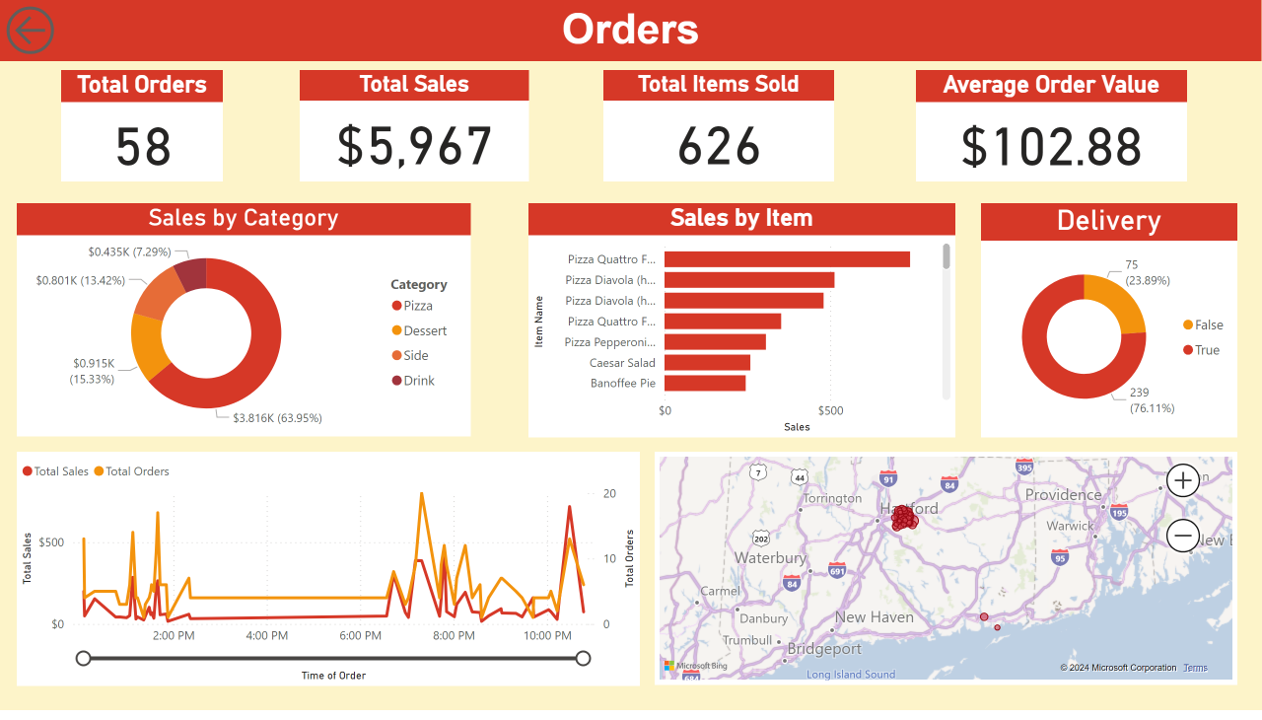
- Sales trends
- Popular items
- Peak ordering times
- Delivery vs. pickup analysis
Inventory Management Dashboard
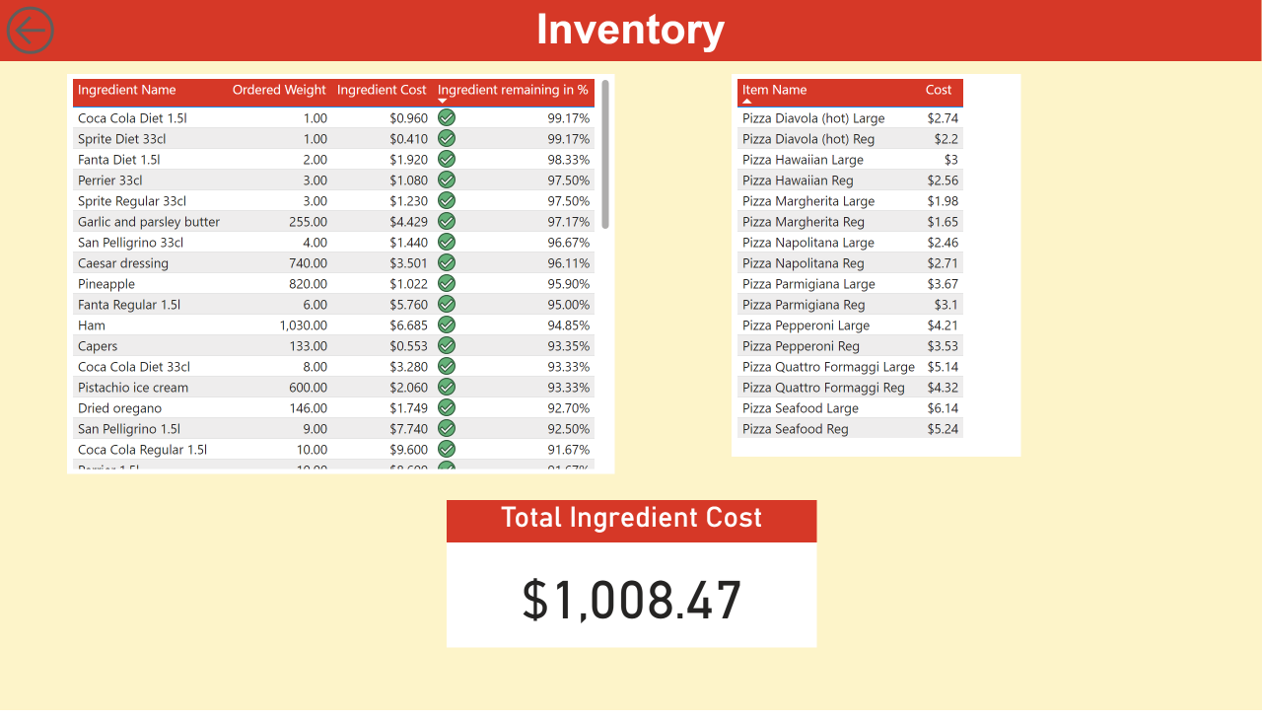
- Stock levels
- Ingredient usage
- Reorder points
- Cost analysis
Staff Management Dashboard
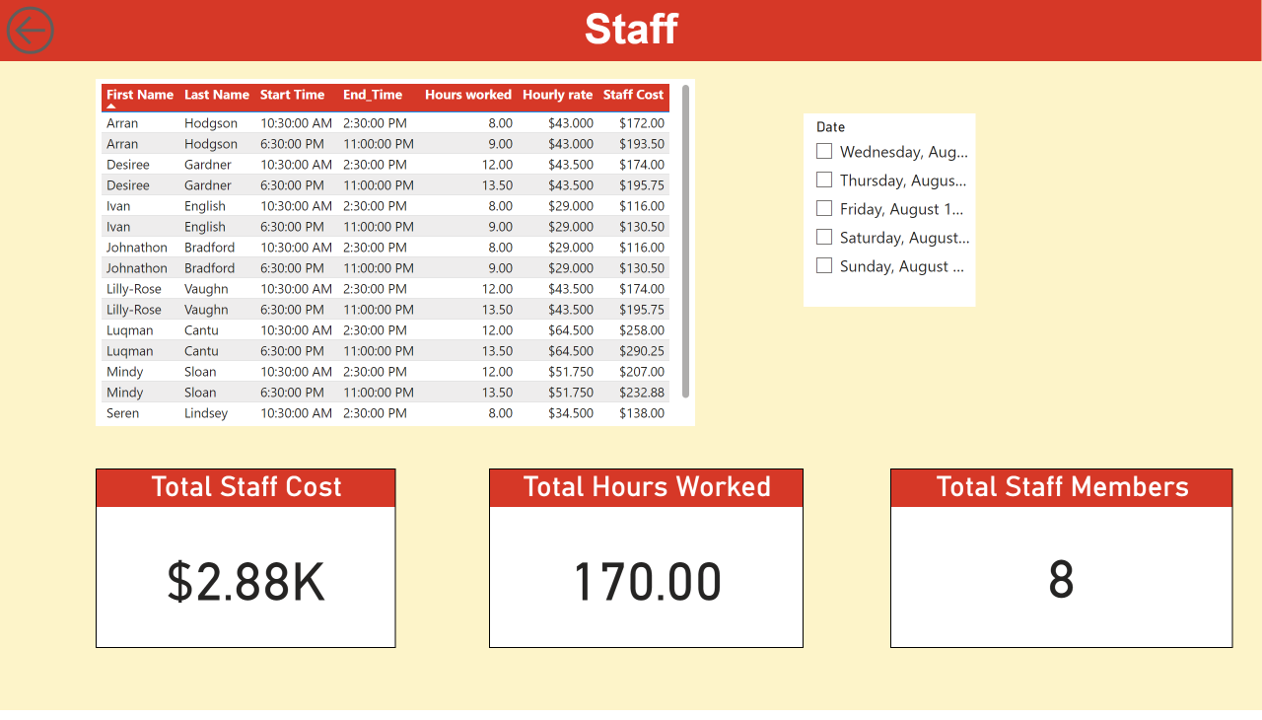
- Labor costs
- Shift coverage
- Peak staffing needs
- Employee efficiency metrics
Analysis & Discovery
Analysis of the data revealed several key insights:
Sales Patterns
- Peak ordering times identified between 5-8 PM
- Higher delivery orders on weekends
- Most popular items are specialty pizzas
Inventory Management
- Several ingredients consistently running low before reorder
- Some ingredients overstocked relative to usage
- Seasonal variation in ingredient usage
Staff Optimization
- Current staffing levels misaligned with peak hours
- Overlap in shift schedules causing inefficiency
- Training needs identified in high-turnover positions
Recommendations
- Inventory Optimization
- Implement automated reordering system
- Adjust stock levels based on usage patterns
- Review supplier contracts for high-use ingredients
- Staff Scheduling
- Realign shift schedules with peak hours
- Reduce shift overlap periods
- Implement cross-training program
- Menu Engineering
- Focus promotion on high-margin items
- Adjust pricing based on ingredient costs
- Streamline menu options during peak hours
Implementation Plan
Phase 1: Database Implementation (Weeks 1-2)
- Set up SQL database
- Migrate existing data
- Test data integrity
Phase 2: Dashboard Deployment (Weeks 3-4)
- Build interactive dashboards
- Train staff on dashboard usage
- Implement feedback loop
Phase 3: Process Optimization (Weeks 5-8)
- Roll out new inventory system
- Update staffing schedules
- Monitor and adjust based on metrics
Success Metrics
- 15% reduction in ingredient waste
- 10% improvement in labor cost efficiency
- 20% faster order processing time
- 95% in-stock rate for key ingredients
This project demonstrates the power of data-driven decision making in restaurant operations, providing a foundation for continued optimization and growth.